
Exploring expected points added (EPA) by different play outcomes
In a previous post, I looked at some run vs pass splits using expected points added (EPA). Here I’m going to explore 20 years of data to look at some basic but I think interesting things related to EPA using the great newish package nflfastr.
Let’s start with a review of EPA. By using models, analysts can estimate the expected number of points (EP) that accompany a given field position, down, distance, and other factors. This calculation is based on hundreds of thousands of plays and looks at the liklihood of the next score (possibilities include a touchdown or field goal for the team with the ball, no score, or safety, field goal, or touchdown for the opposing team).
- EP basics explained here
- EP model construction for nflfastr, which differs slightly from other EPA models.
As a simple example of expected points (EP) and expected points added (EPA) is descibed here:
Suppose the offense has a 1st and 10 at midfield. This situation is worth +2.0 EP. A 5-yard gain would set up a 2nd and 5 from the 45, which corresponds to a +2.1 EP. Therefore, that 5-yard gain in that particular situation represents a +0.1 gain in EP.
This example play was worth .1 EPA.
Here I wanted to take a look at some common outcomes of passing plays to get an idea of what a typical pass play generates in terms of EPA, specifically completed passes, incomplete passes, sacks, and interceptions. I also included runs for comparison. Anybody who follows football certainly realizes that completed passes are generally positive for the offense (though they sometimes lose yards), while incomplete passes, sacks, and interceptions are almost always negative.
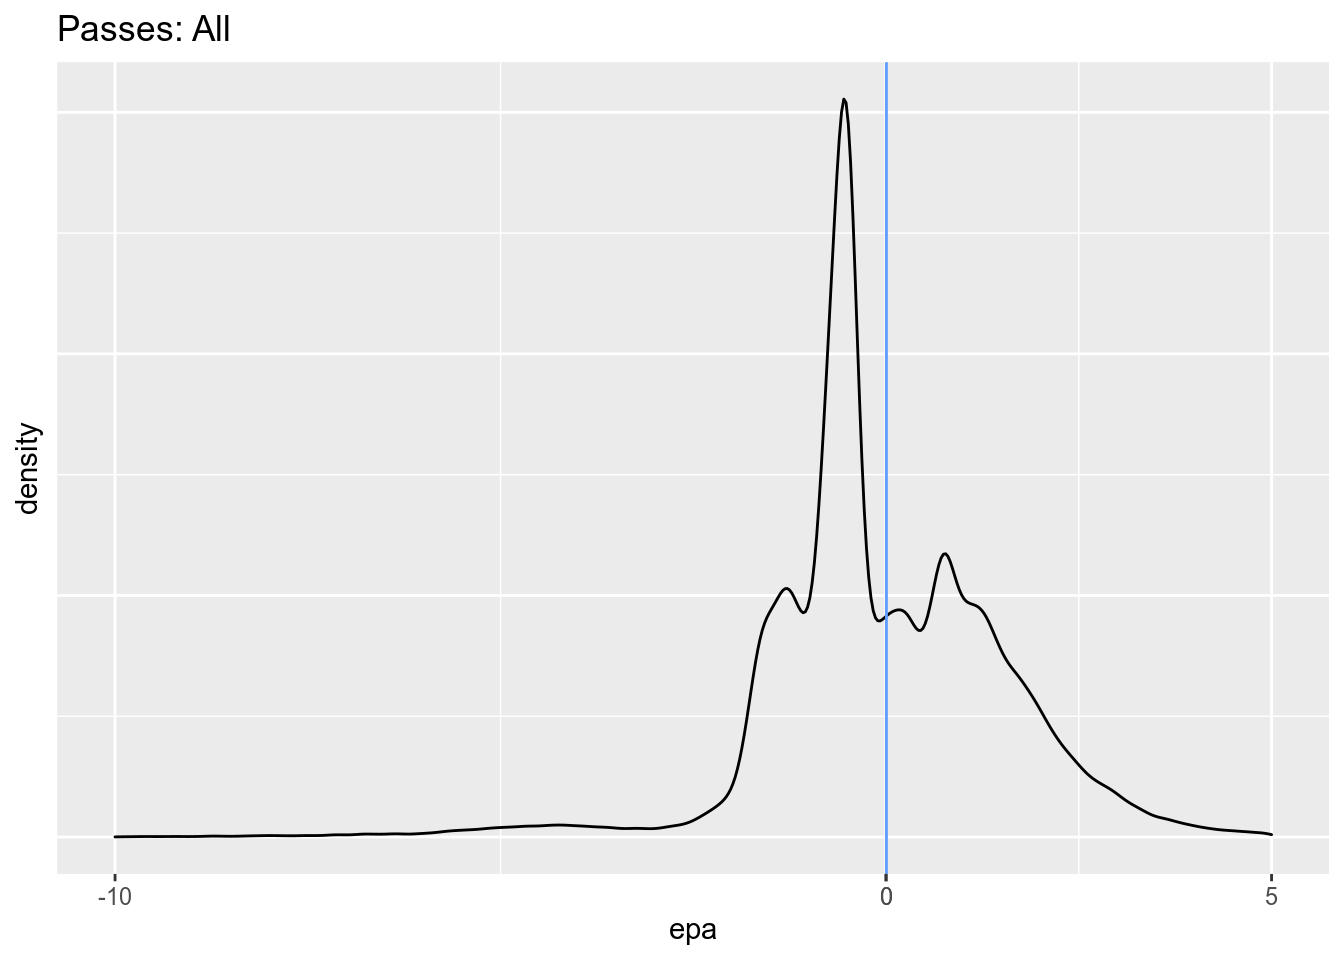
Let’s look at the entire distribution of EPA as well, to get an idea of the spread of each outcome. I’ll concentrate on regular season games and neutral game situations, where win probability is between 20 and 80 percent, where there are more than five minutes remaining in the game, and look only at first through third downs. Over the 2000-2019 seasons this covers 172040 plays.
The blue vertical line in each figure is the mean. Looking at all passes, we have an average EPA of zero. It looks like passes are giving us the finger for not running more of them.
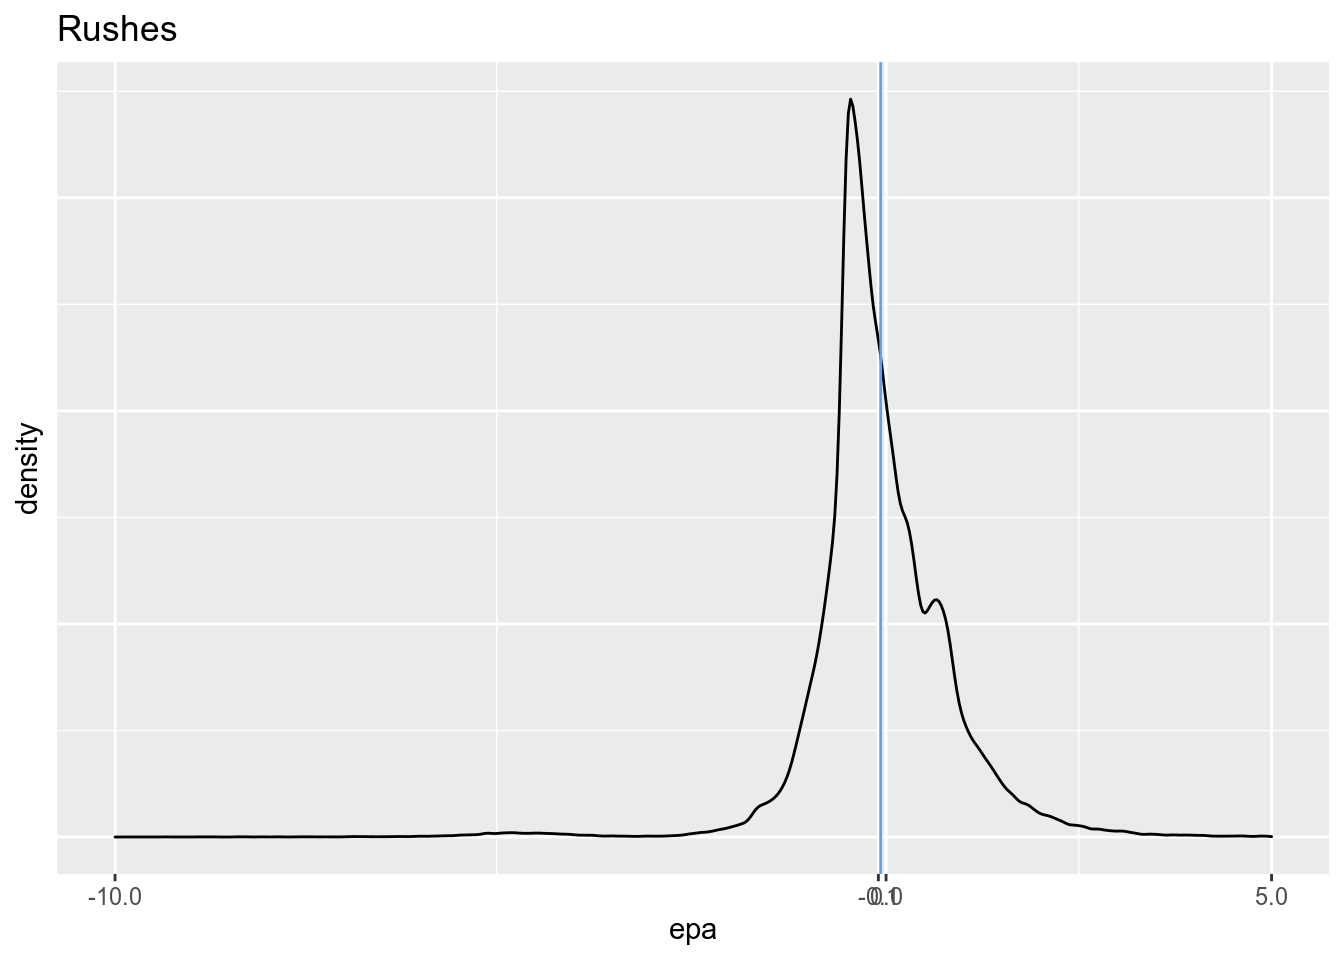
Rushes, meanwhile, have a mean EPA of slighly less than zero, and a much narrower distribution of EPA.
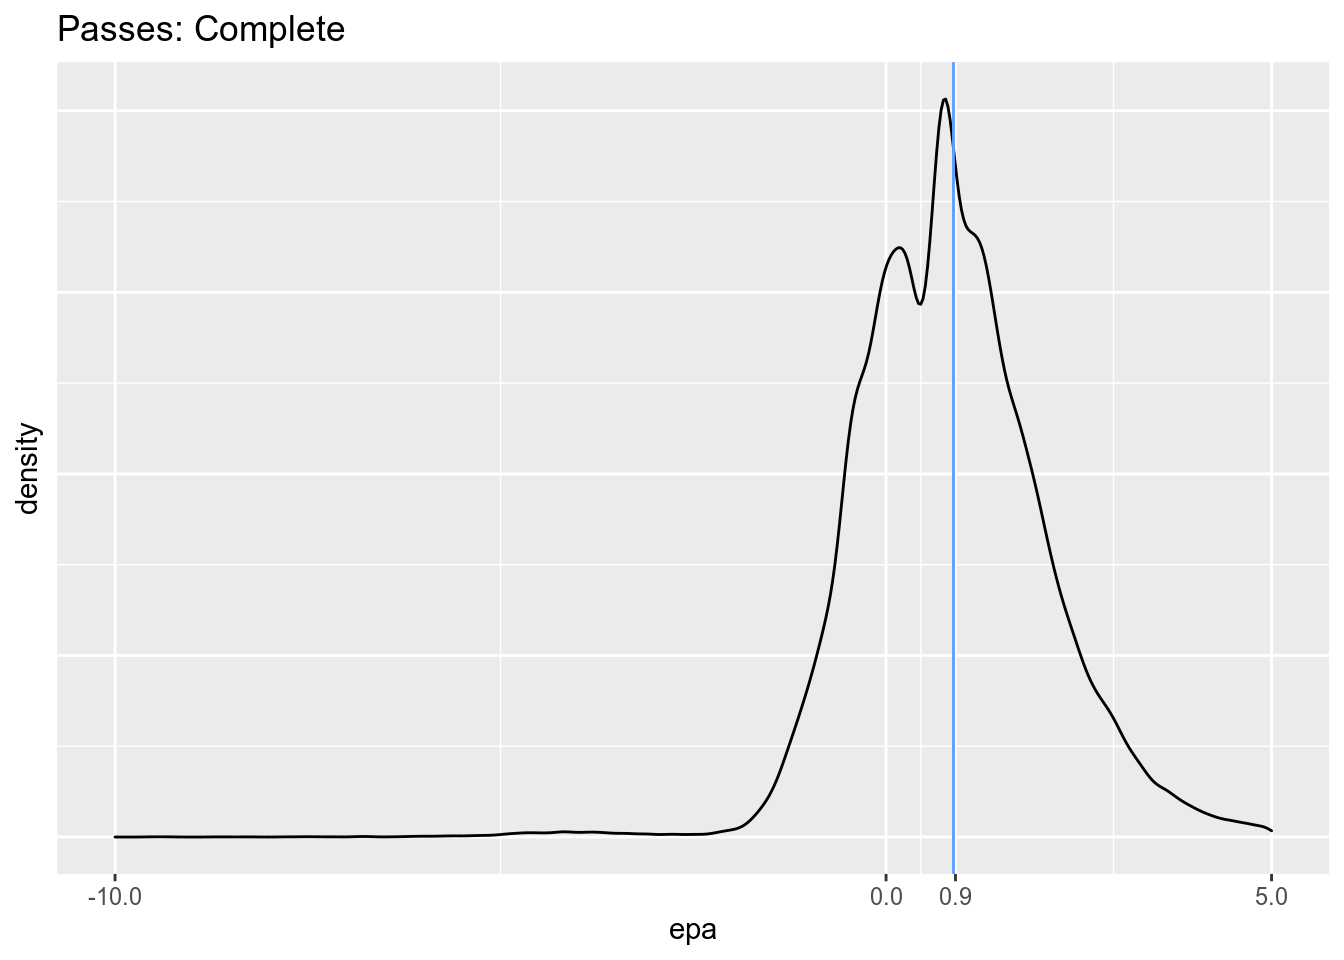
Completed passes are where all the upside is, obviously, with an average EPA gain of .9.
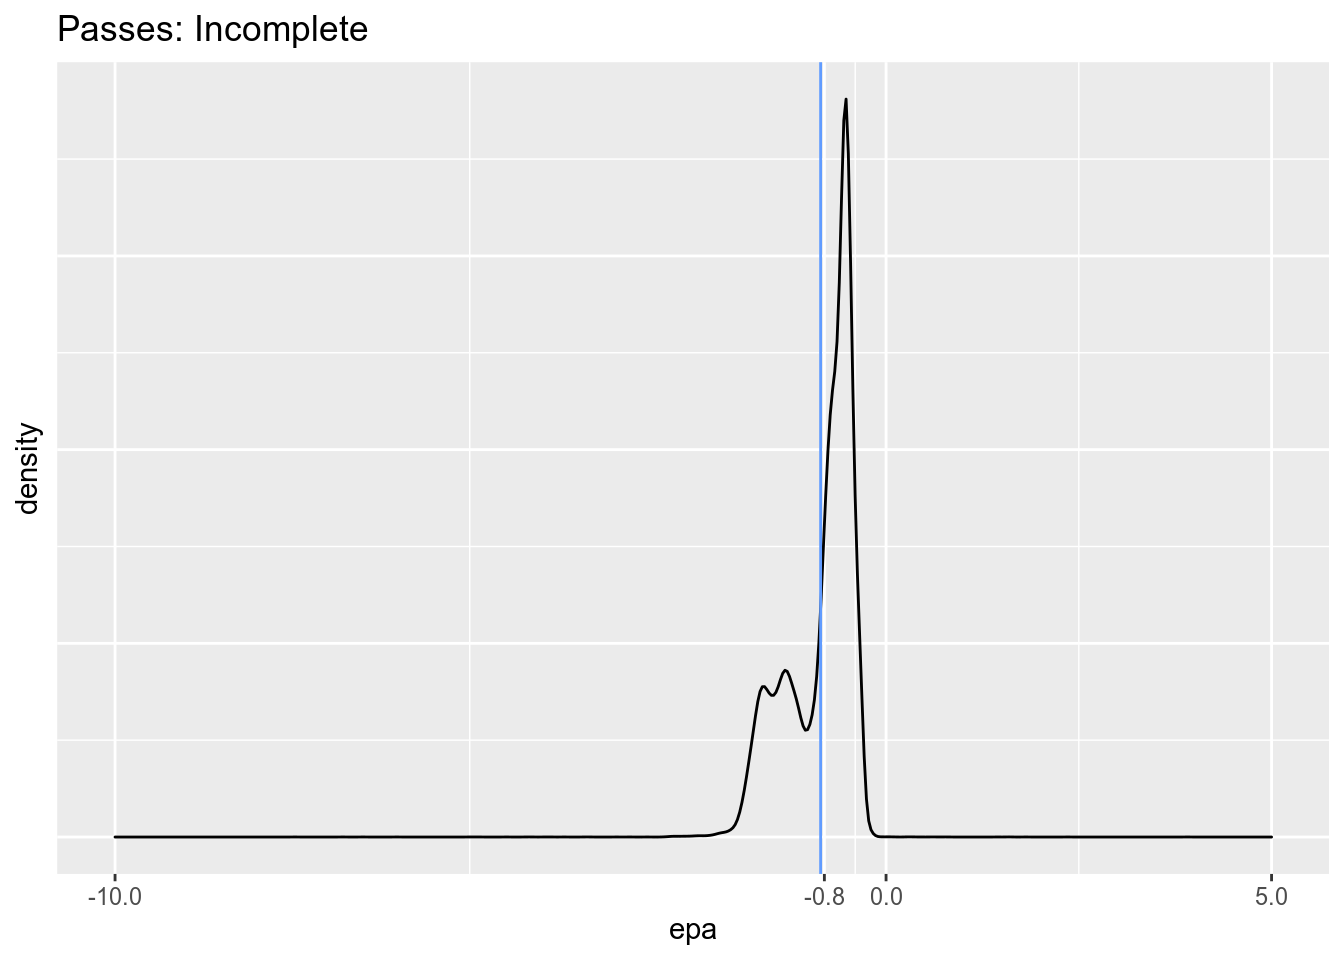
Incomplete passes cost an offense around .8 EPA, and are never positive.
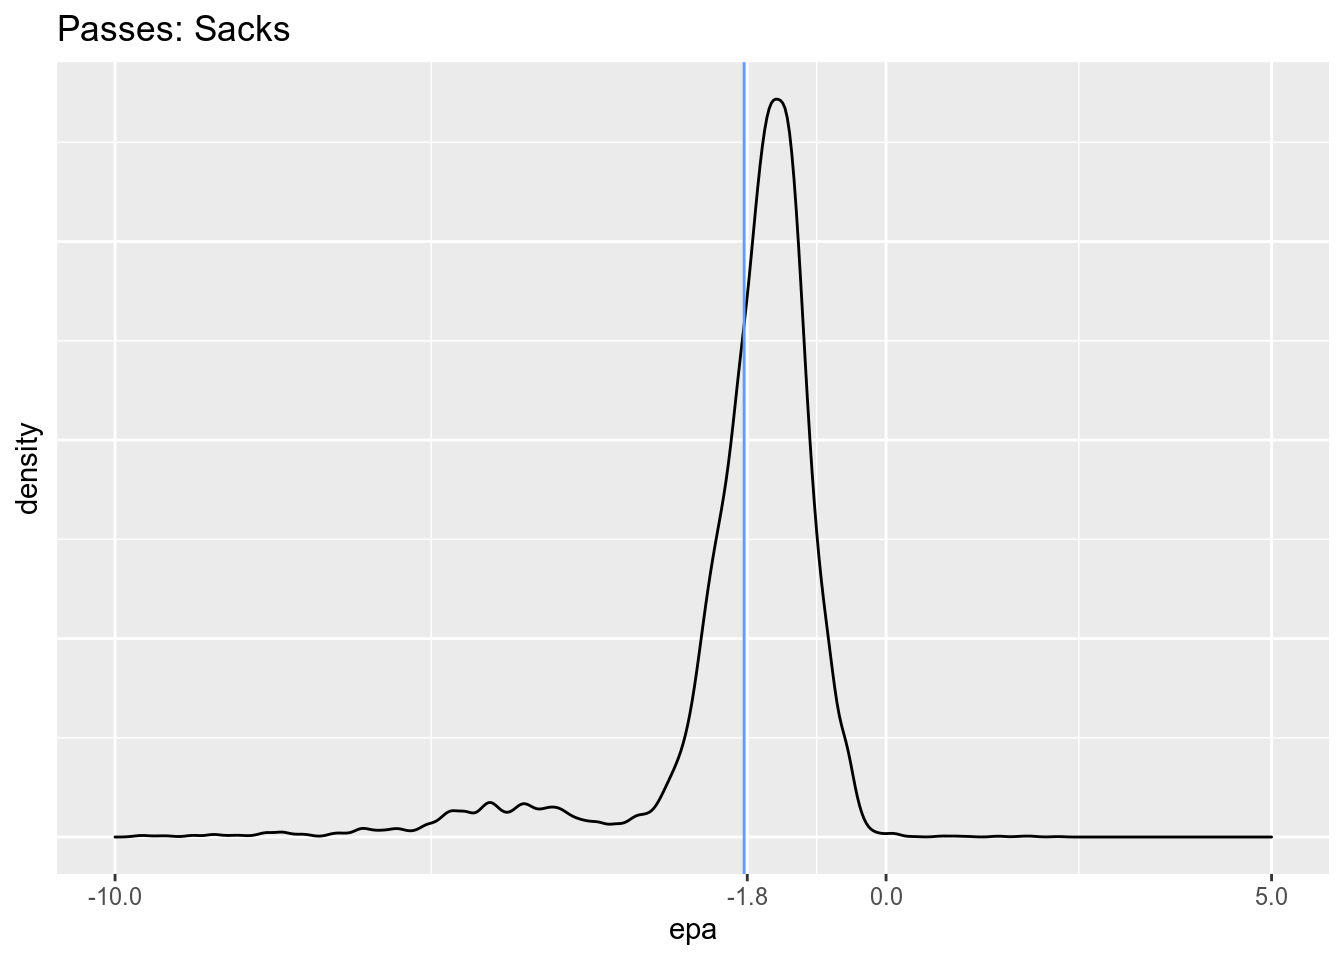
Sacks cost an offense 1.8 EPA, and are never positive.
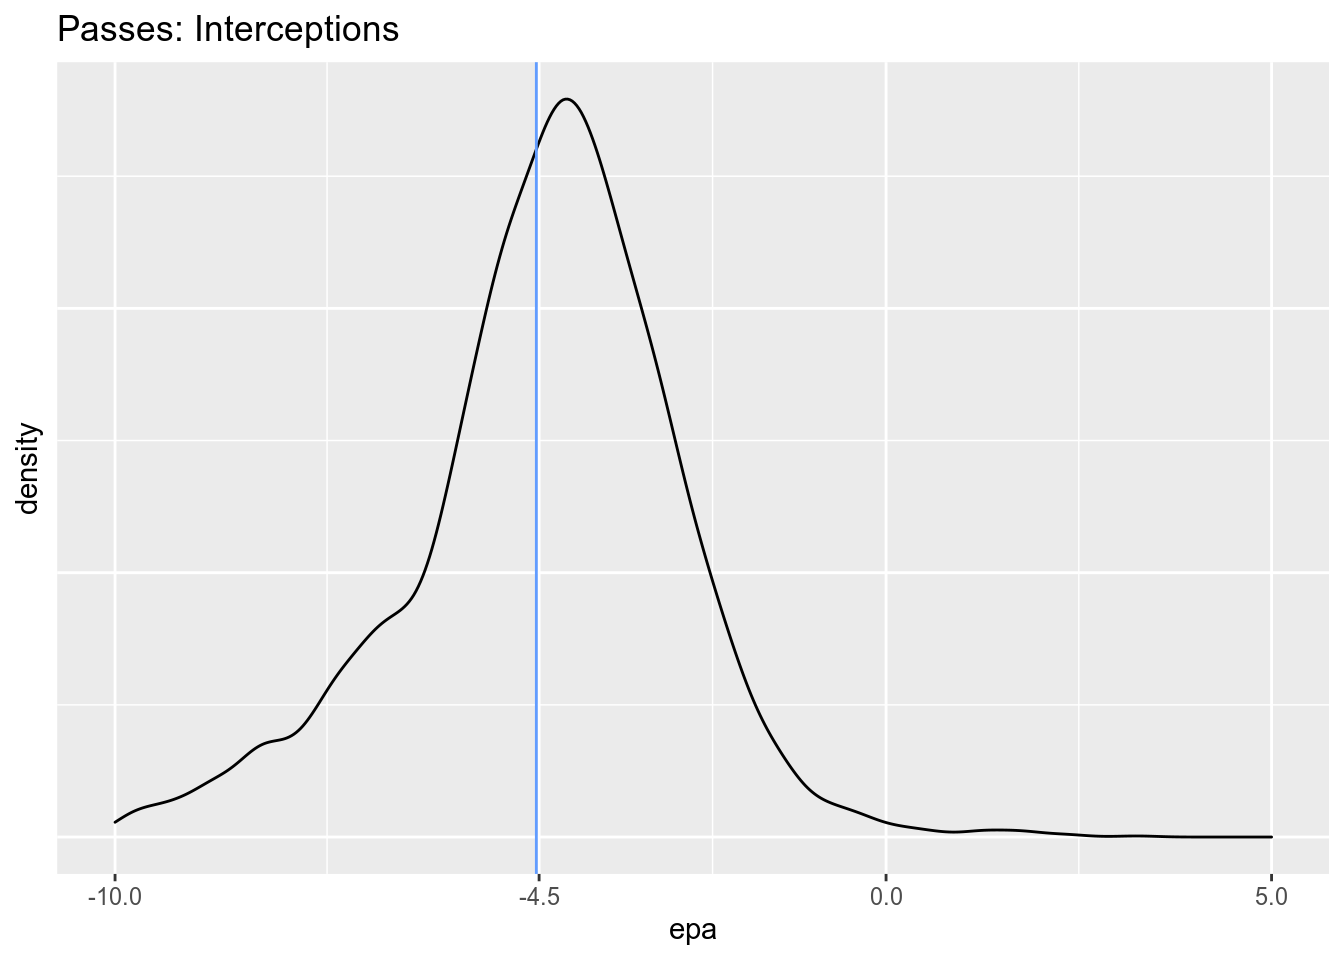
Interceptions are very costly, averaging a cost of 4.5 EPA for the offense, with a lot of variance. If you squint you can see that there are a small number of interceptions that are positive EPA. At first I thought these would be plays where a long pass is intercepted close to the defense’s goal line (like a long punt), but it turns out these were almost all plays where there was an interception followed by a fumble that the offense recovered.
I conclude that in general, fans can watch a game and conclude that the average pass completion is worth a little less than a point, the average incompletion costs about a point, the average sack about two points, and the average interception 4-5 points.
