Expect points added cheatsheet
Like everyone else I am hoping that we have NFL football this fall, but also like everyone else I want that to be safe (at least as far as football can be) from virus related problems. I doubt that will happen but we’ll see.
When sitting in the stands, I’ve sometimes mentioned the concepts of expected points (EP) and expected points added (EPA) but I’ve never had a great feel for how many EP a given situation was worth. Farther away from the end zone is obviously less than close to the end zone, and first down is better than third down, but what specific EP should we expect in a given situation?
To help the average fan, I’ve used the latest version of nflfastR (2.1.0) to build the cheetsheet below. This two pager is the same information in table and graphic format. It’s designed to be printed out and carried to a game, or to sit next to you on the couch so can refer to it during the course of watching games.
Get the cheat sheet here.
EP table:
| YdsToEndzone | 1d&10 | 2d&10 | 2d&7 | 2d&5 | 2d&3 | 2d&1 | 3d&10 | 3d&7 | 3d&5 | 3d&3 | 3d&1 |
|---|---|---|---|---|---|---|---|---|---|---|---|
| 10 | 5.0 | 4.5 | 4.6 | 4.8 | 4.9 | 5.2 | 3.8 | 3.9 | 4.1 | 4.3 | 4.6 |
| 15 | 4.8 | 4.4 | 4.4 | 4.6 | 4.7 | 5.0 | 3.7 | 3.8 | 3.9 | 4.1 | 4.4 |
| 20 | 4.4 | 4.0 | 4.1 | 4.3 | 4.3 | 4.5 | 3.4 | 3.5 | 3.7 | 3.7 | 4.1 |
| 25 | 4.1 | 3.7 | 3.8 | 3.9 | 4.0 | 4.2 | 3.1 | 3.2 | 3.4 | 3.4 | 3.7 |
| 30 | 3.8 | 3.4 | 3.5 | 3.6 | 3.7 | 3.9 | 2.7 | 2.8 | 2.9 | 3.1 | 3.3 |
| 35 | 3.5 | 3.0 | 3.1 | 3.3 | 3.4 | 3.6 | 2.3 | 2.3 | 2.5 | 2.7 | 3.0 |
| 40 | 3.2 | 2.6 | 2.8 | 2.9 | 3.0 | 3.2 | 1.9 | 1.9 | 2.1 | 2.3 | 2.7 |
| 45 | 2.8 | 2.4 | 2.4 | 2.6 | 2.8 | 3.0 | 1.6 | 1.7 | 1.8 | 2.0 | 2.5 |
| 50 | 2.5 | 2.1 | 2.1 | 2.3 | 2.4 | 2.7 | 1.3 | 1.3 | 1.5 | 1.6 | 2.1 |
| 55 | 2.2 | 1.7 | 1.8 | 2.0 | 2.0 | 2.4 | 0.9 | 1.0 | 1.1 | 1.3 | 1.8 |
| 60 | 1.8 | 1.3 | 1.4 | 1.6 | 1.7 | 2.0 | 0.6 | 0.7 | 0.8 | 0.9 | 1.5 |
| 65 | 1.5 | 0.9 | 1.0 | 1.2 | 1.3 | 1.7 | 0.3 | 0.3 | 0.5 | 0.6 | 1.1 |
| 70 | 1.2 | 0.7 | 0.8 | 1.1 | 1.1 | 1.5 | 0.1 | 0.1 | 0.3 | 0.5 | 1.0 |
| 75 | 1.1 | 0.5 | 0.5 | 0.7 | 0.8 | 1.1 | -0.2 | -0.2 | 0.0 | 0.1 | 0.6 |
| 80 | 0.6 | 0.1 | 0.1 | 0.3 | 0.5 | 0.6 | -0.6 | -0.5 | -0.4 | -0.2 | 0.2 |
| 85 | 0.2 | -0.3 | -0.3 | 0.0 | 0.2 | 0.4 | -0.9 | -0.9 | -0.8 | -0.6 | -0.2 |
| 90 | -0.1 | -0.6 | -0.6 | -0.4 | -0.1 | 0.1 | -1.3 | -1.2 | -1.1 | -0.8 | -0.5 |
| 95 | -0.4 | -0.9 | -0.9 | NA | NA | NA | -1.6 | -1.5 | NA | NA | NA |
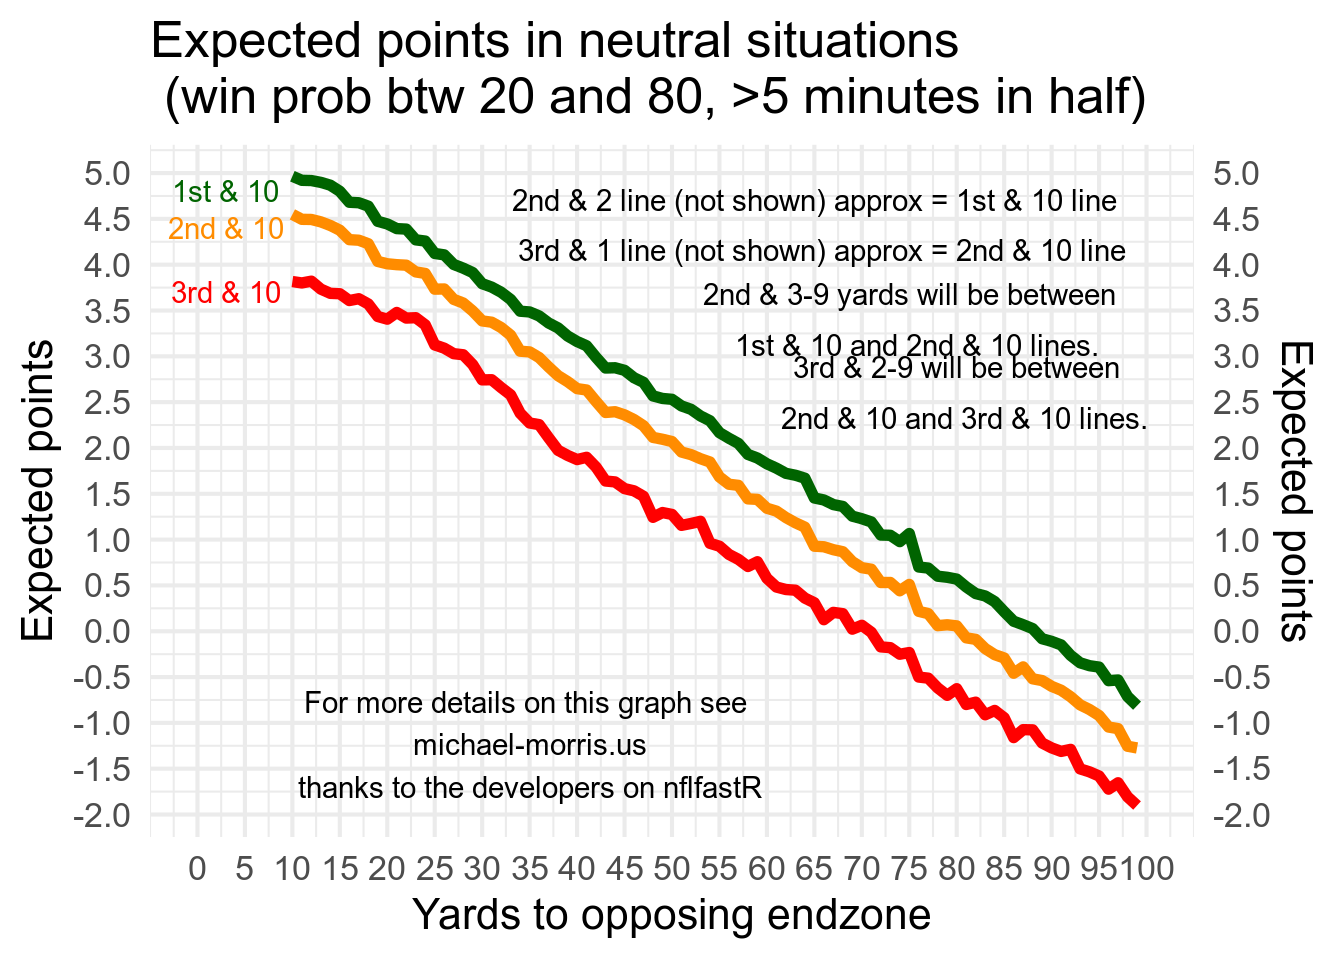
EP figure